TigerWeb is FORECON’s proprietary forest inventory software and mapping platform designed for organizations managing hardwood timberlands at scale. It combines GIS mapping, cruise data, growth and yield modeling, and reporting into a single system that works from your browser with no specialized software required.
Interactive Forest Mapping with GIS Layers
Traditionally, forest managers rely on a mix of GIS software, spreadsheets, cruise databases, and growth modeling tools. The TigerWeb forest inventory software combines all of these into a single browser-based platform.
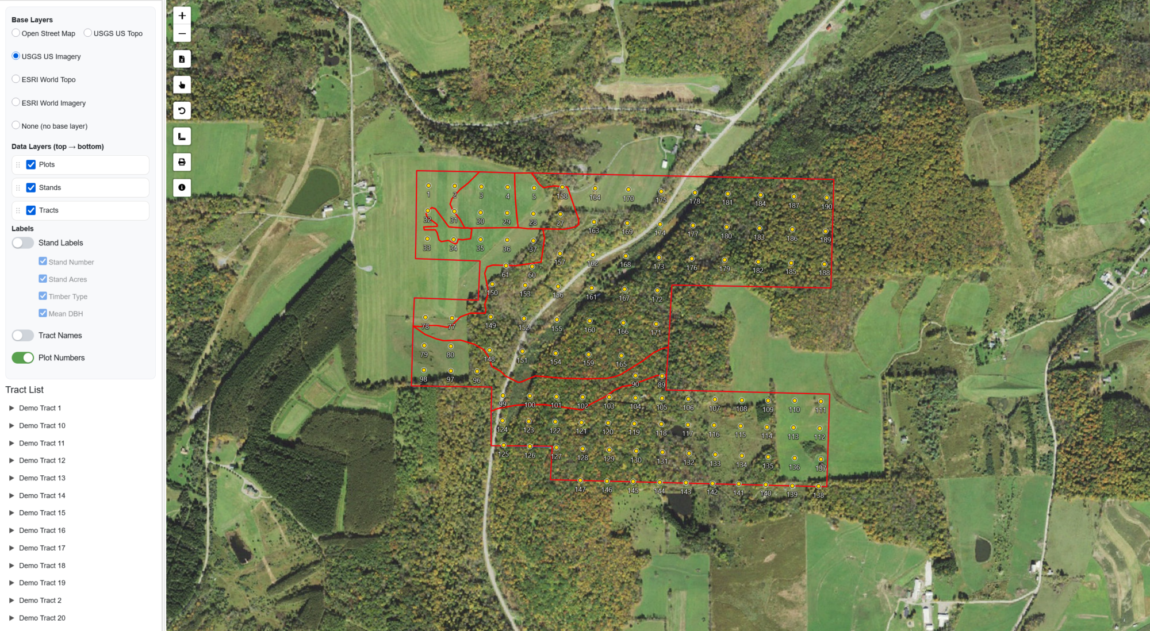
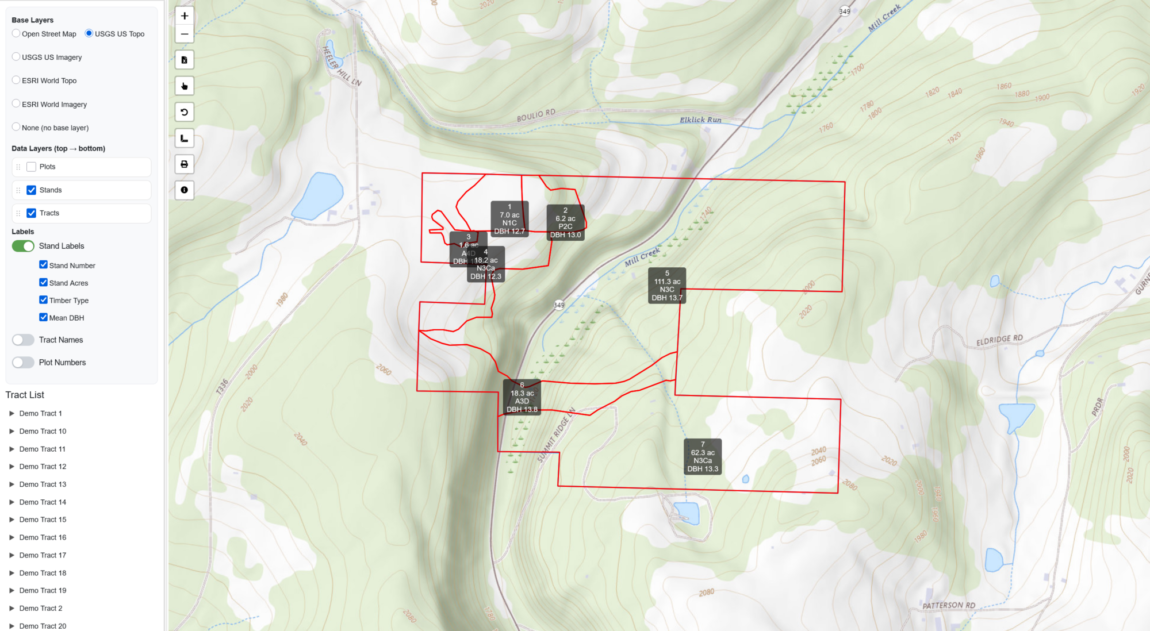
TigerWeb's mapping interface is the home base for everything else on the platform. With a single click, you can see your full portfolio of tracts and stands drawn directly over satellite imagery, topographic maps, or USGS base layers. Tract boundaries, stands, and plot locations are always visible at any scale.
The content panel gives you a full tract list and layer controls, letting you toggle data layers on or off without leaving the map. Label overlays include:
- Tract name
- Stand number
- Timber type
- Average diameter breast height (DBH)
- Stand acres
- Point/plot numbers so your team can navigate the landscape with full context right on screen
Instant Access to Plot, Stand, and Tract Inventory Data
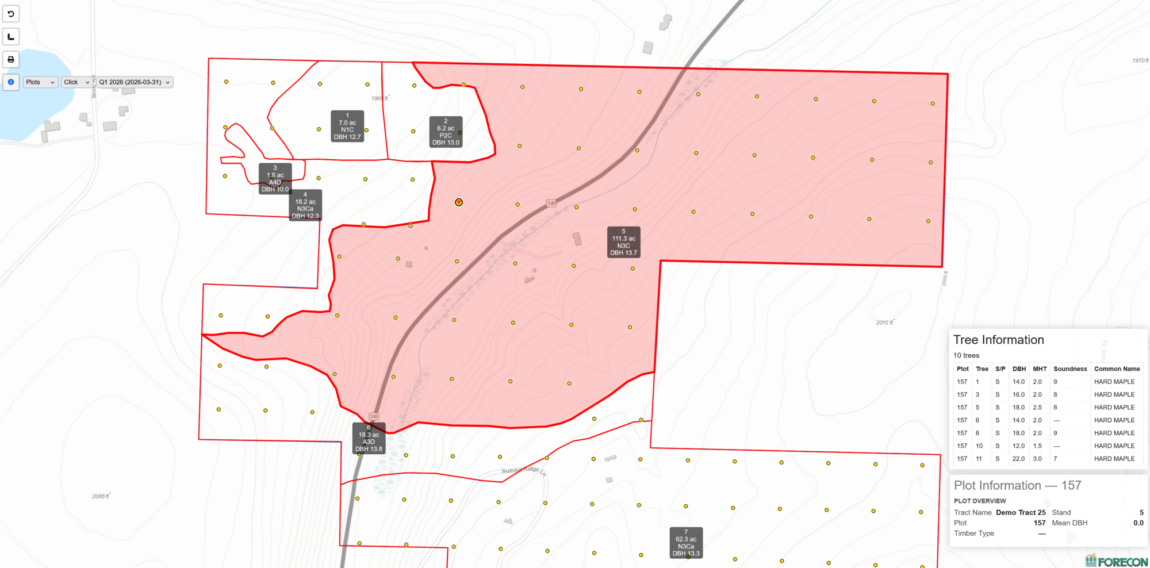
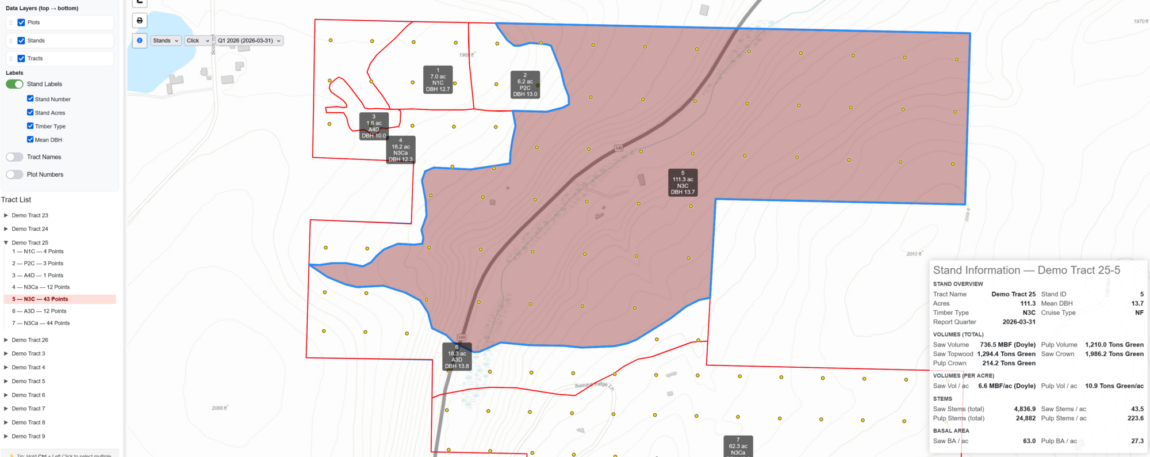
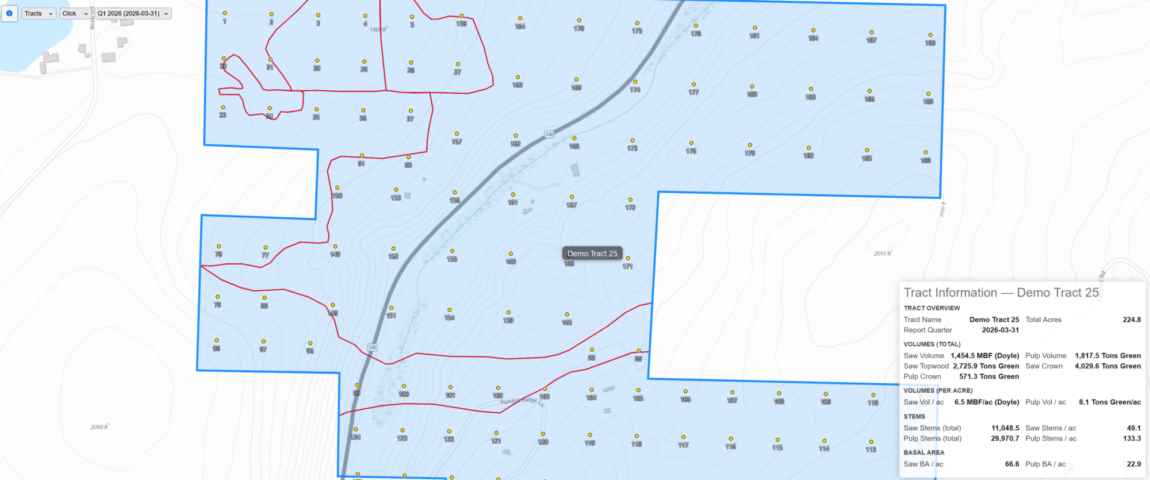
One of TigerWeb's most practical capabilities is its Info Tool. Click anywhere on the map; plot, stand boundary, or tract and the platform immediately shows the relevant information. There are no queries to write, no exports to pull, and no switching applications in this single platform.
- PLOT LEVEL: Individual tree records, including plot, tree number, product, DBH, height, soundness/defect and species
- STAND LEVEL: Stand overview including tract name, stand acres, timber type, stand number, mean DBH, Volume totals, per-acre volumes, stem totals, per-acre stems and per-acre basal area
- TRACT LEVEL: Tract overview including tract name, total acres, total volume, per-acre volumes, stem totals, per-acre stems and per-acre basal area as well as saw topwood, saw crownwood and pulp crownwood volumes.
Draw Any Area and Generate a Timber Growth Projection
TigerWeb's Ad-Hoc Report tool is built for the kind of analysis that doesn't fit neatly into a predefined management boundary. Maybe you have a potential harvest area that crosses stand lines? Or maybe you're evaluating a corridor for a conservation easement or pricing out a specific block of timber for a negotiated sale? With the Ad-Hoc tool, you draw the area of interest directly on the map, set a projection year, and let TigerWeb's growth engine do the rest.
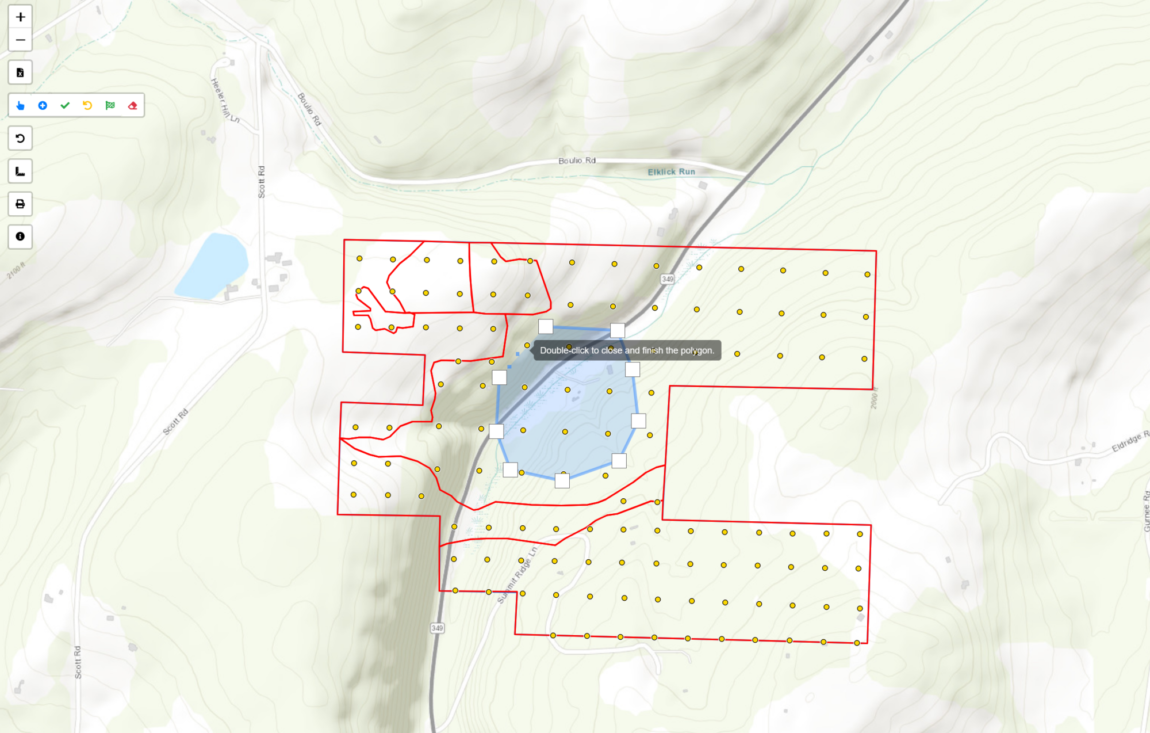
"Draw any shape on the map. Set a target year. TigerWeb applies hardwood growth models developed by the United States Forest Service. These models are widely recognized and respected within the forestry community for their underlying cruise data to project volume, stems, and basal area by product."
Behind the scenes, the TigerWeb forest inventory software pulls in the underlying plot-level inventory data from all intersecting cruise points. It then applies FORECON's established growth and yield models. The result is a formatted Excel report that breaks out estimated volume, stem and basal area by product class and species at the projected date.
This workflow is especially useful for budgeting, harvest planning, and timber sale preparation. TigerWeb is critical anytime you need a fast, credible volume estimate for a specific harvest block before committing to the full marking and sale process.
Forest Inventory Reports at Any Management Level
In addition to ad-hoc polygon analysis, FORECON's forest inventory software includes a Static Reports module for generating standardized inventory summaries across defined management levels. Reports can be run at the full Management Unit, selected Tracts, or individual Stands. You can also control whether results are cumulative or reported individually. Users can select which metrics to include such as:
- total volume in both total and per-acre formats
- stems in both total and per-acre formats
- basal area in both total and per-acre formats
- optional breakouts for larger-diameter timber (DBH ≥16″)
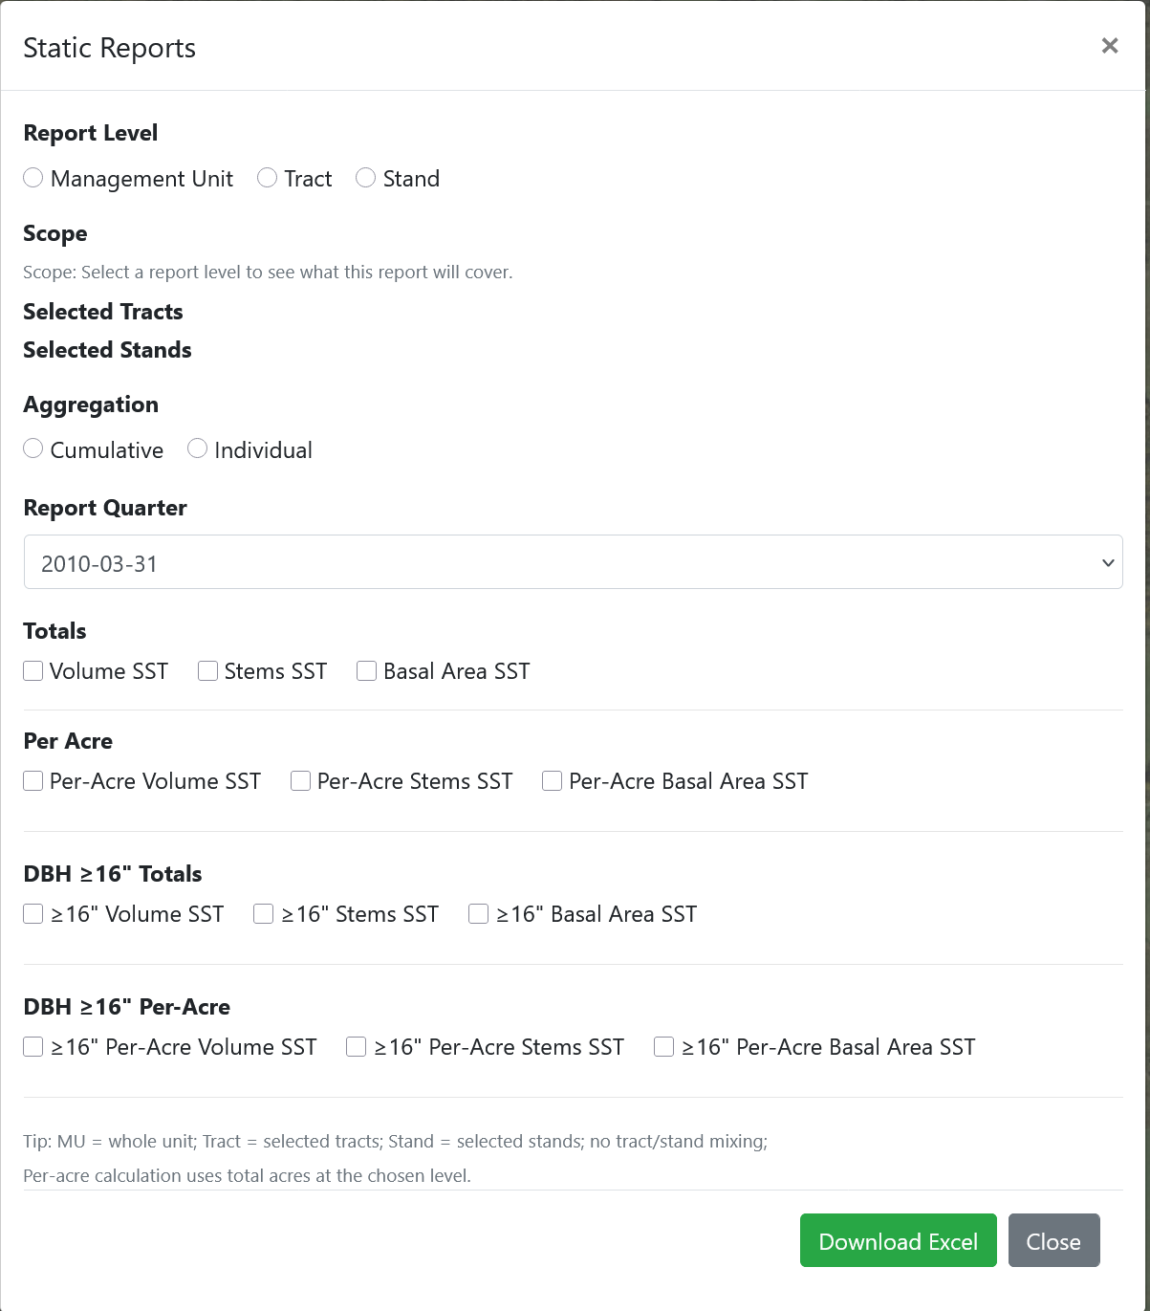
Reports are generated as formatted Excel workbooks and can be downloaded directly from the browser.
Why TigerWeb Replaces GIS software, Spreadsheets, and Cruise Databases
The TigerWeb forest inventory software isn't a replacement for field work, expertise, or the judgment that good forest management requires. It's a forest inventory software tool that removes friction between collecting data and acting on it. The inventory is already there. The growth models are already built. TigerWeb puts them in a form that's fast, accessible, and shareable, without requiring specialized software or a GIS specialist to run a query. Some other unique features include:
- Browser-based with no software installation required
- Integrated mapping and inventory; spatial data and inventory in one place
- On-demand growth projections for any area of interest
- Configurable reporting at the management unit, tract, and stand level
- Clickable info panels at the plot, stand, and tract level with no queries needed
- Multiple base map options including aerial imagery, USGS topo, and street maps
- Excel report output designed for internal use and landowner communication
Who TigerWeb Is Designed For
TigerWeb is designed for organizations managing hardwood timberlands at scale, where numerous tracts, stands, and multiple consecutive cruise cycles must be efficiently tracked, analyzed, and maintained. This includes lumber mills, family trusts, municipal landowners, land stewardship groups, and institutional investors.
Learn More or Schedule a Demo
TigerWeb is purpose-built forest inventory software for hardwood timberland management. It combines GIS mapping, cruise data, growth modeling, and reporting into a single browser-based platform. Let TigerWeb forest inventory software deliver accurate, up-to-date inventory data to help you make informed decisions. Read more about TigerWeb or request a demo.
See TigerWeb in Action