
The latest FORECON timber market tracker covers the second quarter of 2026 (April through June), using Penn State Extension’s Pennsylvania Timber Market Report. FORECON’s own Gunner Fravel, Staff Forester, is featured in the report with a photograph of a Fall job site.
In this Q2 update, we focus on six commercially important hardwood species to help landowners understand changes in timber value. Small survey samples can produce large price swings, and missing observations are shown as gaps in the charts.
Pennsylvania Hardwood Timber Prices Snapshot Q2 2026
Key observations from the Q2 2026 data include:
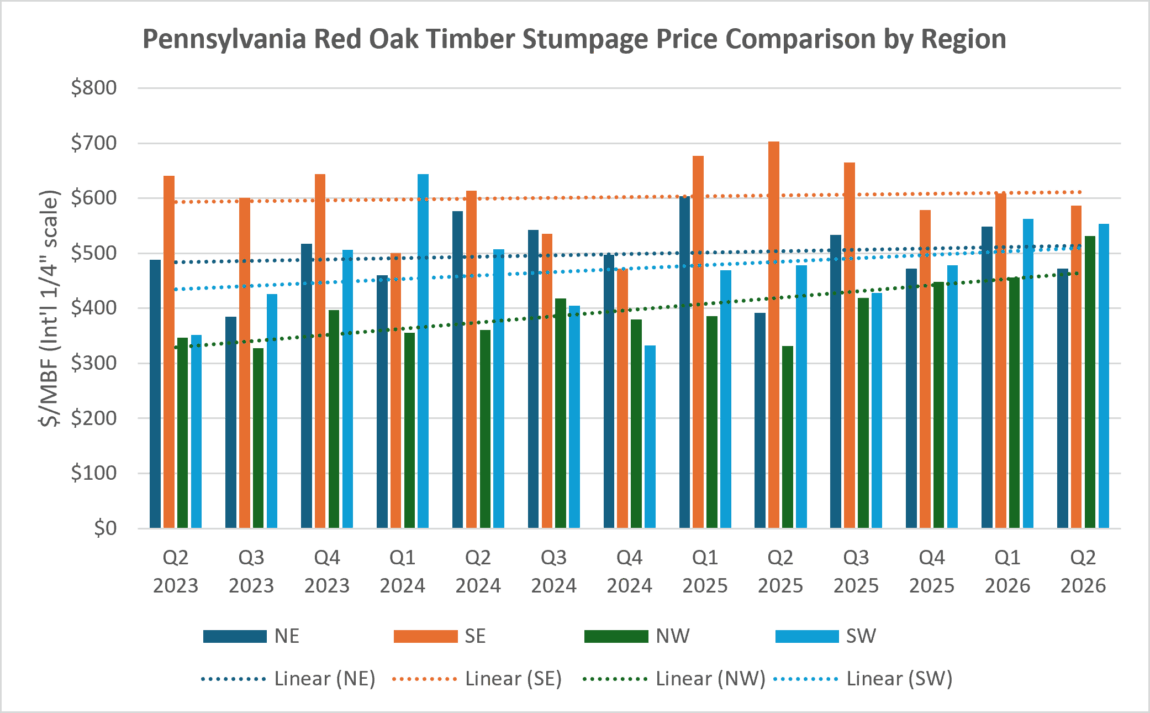
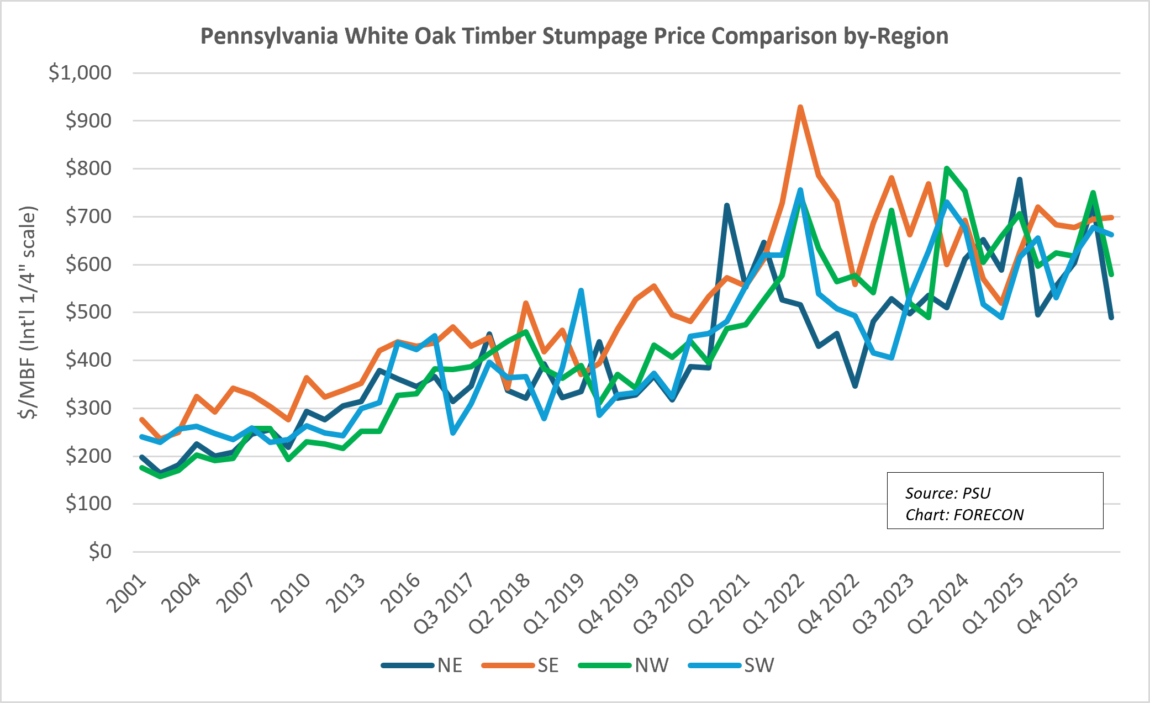
- Regional differences remain substantial. Red oak average prices ranged from $472 to $587 per thousand board feet (MBF), while white oak ranged from $490 to $698.
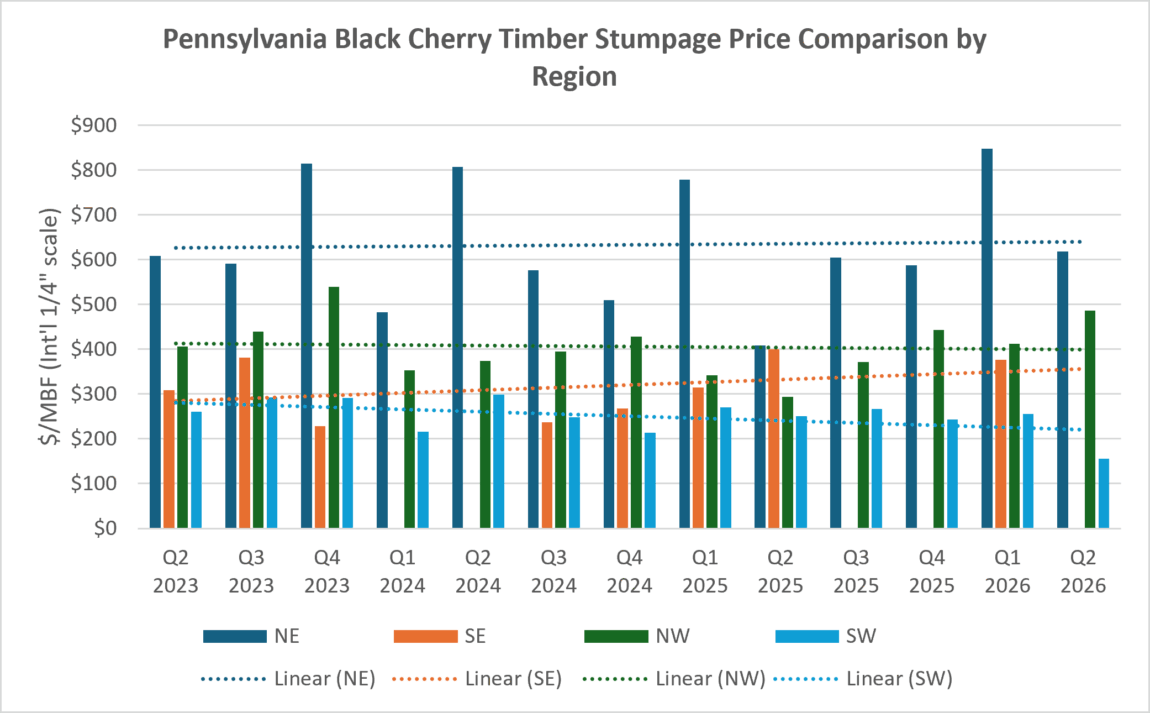
- Northwest red oak and black cherry recorded year-over-year gains of 60% and 65%, respectively. Both also increased from Q1 2026.
- White oak was within approximately 3% of 2025 prices in all four regions, despite quarterly declines of 33% in the Northeast and 23% in the Northwest.
These figures provide a regional benchmark. Actual prices still depend on the timber being offered and the buyers competing for it.
Red Oak
- Year-over-Year: Northwest red oak rose 60% from this time in 2025 and, for the first time in the three-year chart, exceeded the Northeast’s average. The Southeast declined 17%.
- Market Implications: The Northwest’s year-over-year and quarterly gains suggest improving opportunities for red oak sellers in that region. With prices easing elsewhere, landowners should assess local buyer interest before assuming the same strength applies to their timber.
White Oak
- Year-over-Year: White oak’s sharp quarterly declines in the Northeast and Northwest look less alarming with a longer perspective. All four regions finished within about 3% of their 2025 averages, and values remain well above those typical of the 2000s.
- Market Implications: White oak remained above red oak in all four regional averages. Its sharp quarterly declines in the Northeast and Northwest contrast with nearly unchanged prices in the Southeast and a 2% decline in the Southwest. As a result, the latest pullback looks more like a retreat from recent spikes than a return to older price levels.
Black Cherry
- Year-over-Year: The Northwest’s 65% annual gain looks dramatic, but Q2 2025 was its lowest cherry average in the three-year chart. The latest quarter also reached its highest level since late 2023, making this a notable rebound within the period shown. Southwest cherry, on the other hand, fell to its lowest point in the same chart. No Southeast price observations were available for Q2 2026.
- Market Implications: The Northwest rebound suggests improved selling opportunities for cherry owners there, but weaker results elsewhere point to an uneven recovery. Landowners considering a sale should gauge buyer interest in their specific timber and region.
Hard Maple
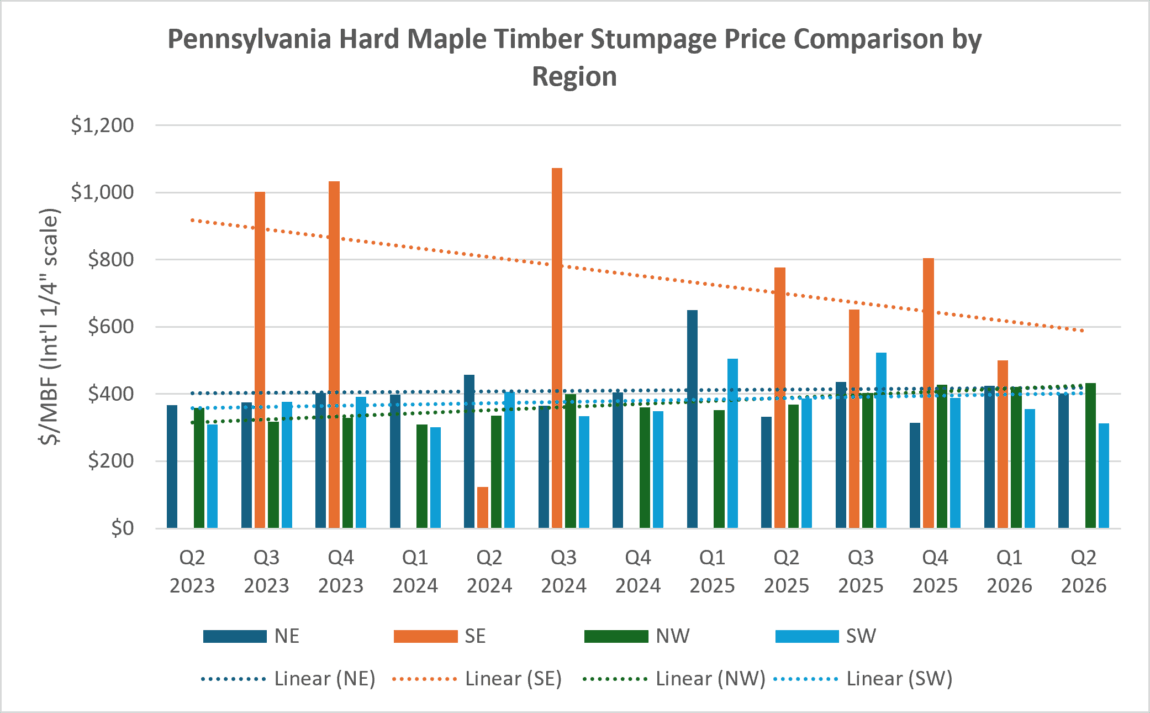
- Year-over-Year: Hard maple increased 21% in the Northeast and 18% in the Northwest, while southwest prices declined 19%. No Southeast price observations were available for Q2 2026.
- Market Implications: Hard maple’s northern recovery is more measured than the oak and cherry gains. The Northwest improved only 3% from Q1, while the Northeast and Southwest softened. Even in a region showing stronger hardwood prices, different species are moving at different speeds. No Southeast observation was available this quarter.
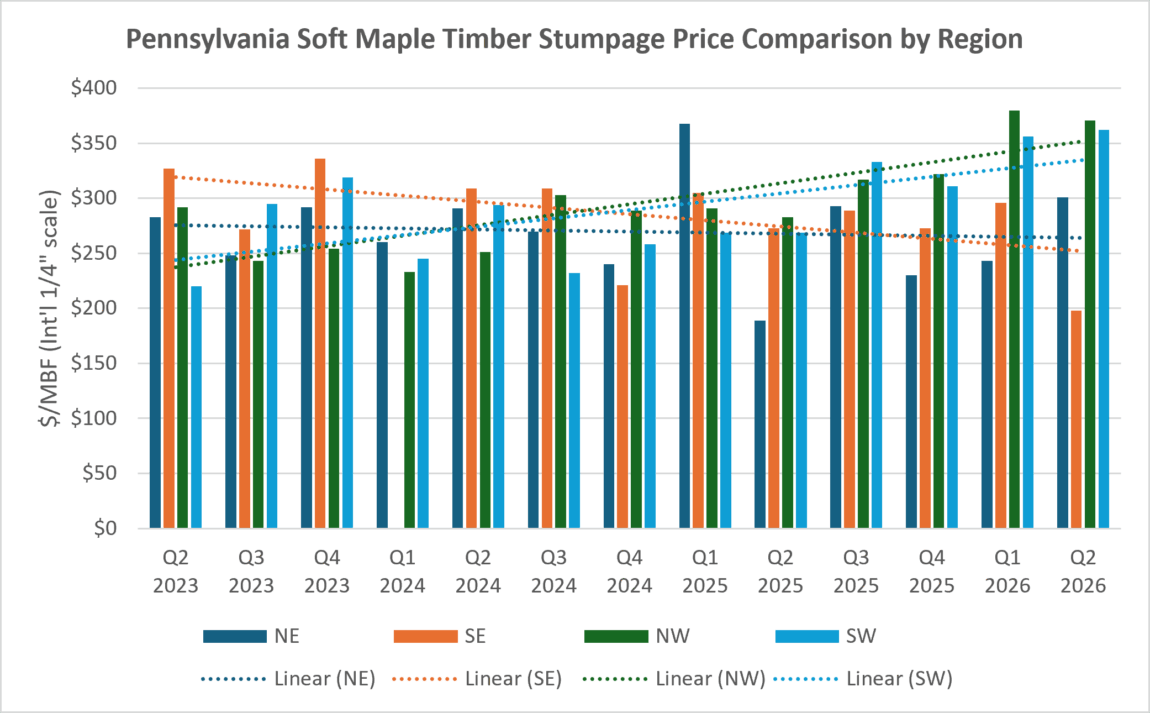
Soft Maple
- Year-over-Year: Soft maple gained 59% in the Northeast, 31% in the Northwest, and 35% in the Southwest. Southeast prices declined 27%.
- Market Implications: The Southwest’s soft maple average exceeded hard maple’s this quarter, a useful reminder that “hard” does not automatically mean more valuable. Meanwhile, the Northeast’s strong annual gain partly reflects a low comparison quarter last year. The Southeast moved the other way, posting its lowest soft maple average in the three-year chart.
Yellow Poplar
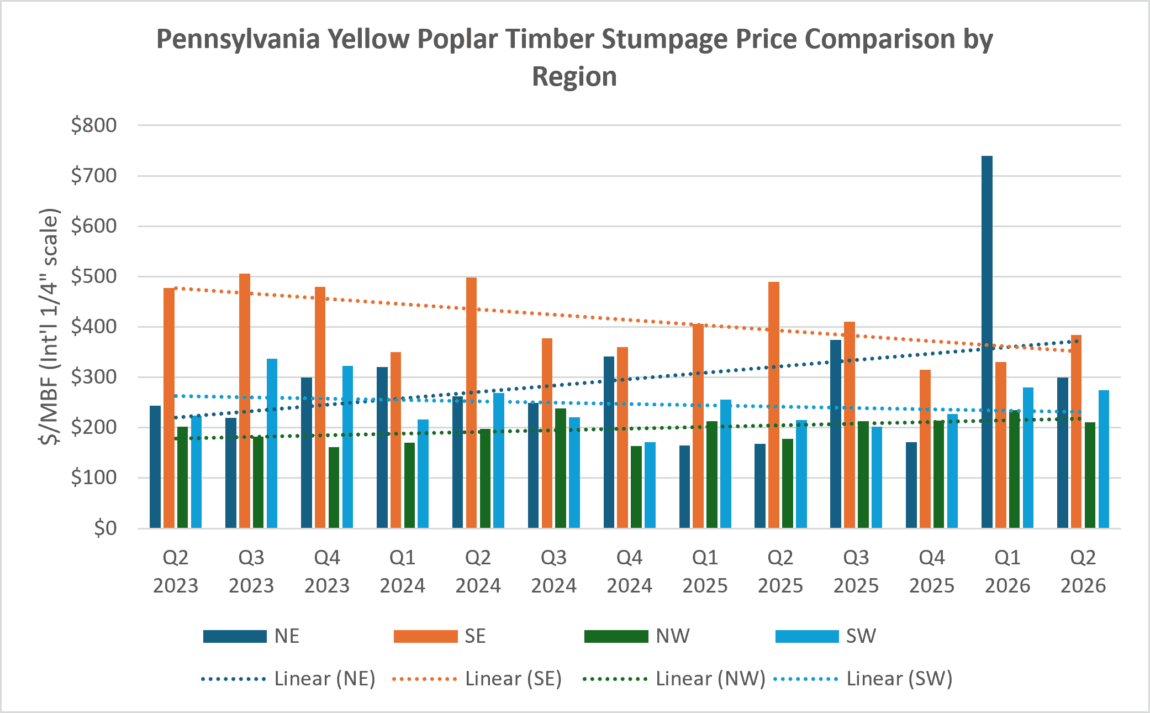
- Year-over-Year: Yellow-poplar increased 79% in the Northeast, 19% in the Northwest, and 27% in the Southwest. Southeast prices declined 21%.
- Market Implications: The Northeast’s quarterly average fell 59% from the unusually high Q1 value (which was based on one response). The latest average returned to the range seen in several earlier quarters, while remaining well above 2025 levels. This is a good example of why one unusually high observation should not set expectations for a timber sale.
What Your Timber Is Worth in Pennsylvania
A regional upswing can be encouraging, but it doesn’t guarantee what a buyer will offer for your woodlot. The Northwest’s stronger oak and cherry results may be relevant to an owner with those species, but they say much less about a sale comprised of maple or lower-quality material.
Timber quality, harvest volume, access, operating conditions, and nearby buyers can all outweigh a regional average. A consulting forester can evaluate those factors and match the timber being offered with buyers who can use it.
For landowners considering a harvest, the next step is to assess the property and the available buyers. A professional timber appraisal or competitively marketed sale can help establish value while keeping the harvest consistent with long-term ownership objectives.
For more harvest insights and tips, you can also read our Ask the Forestry Expert article, “How Do I Prepare My Wood for a Future Timber Sale?”
If you’re looking for local, responsive expertise, we encourage you to work with one of our seasoned foresters. Reach out to us here or call (716) 664-5602.
Ask the Forestry Expert: How Do I Prepare My Woods for a Future Timber Sale?
