As of today’s post, the most recent quarterly timber stumpage price data available from Penn State University’s quarterly Timber Market Report is their “Third Quarter, 2025” release. We like to periodically analyze the Penn State reports and offer commentary and insights related to the trends we see, in hopes it provides our readers some value for their future decision making.
The following six charts illustrate the recent improvement we’ve observed, along with historical price trends for hardwood timber stumpage, using data from Pennsylvania University’s quarterly Timber Market Report. While several species are featured in Penn State’s report, we’ve focused on the six with the largest commercial impact on our region’s solid wood products industry. We noted the following regional and species trends:
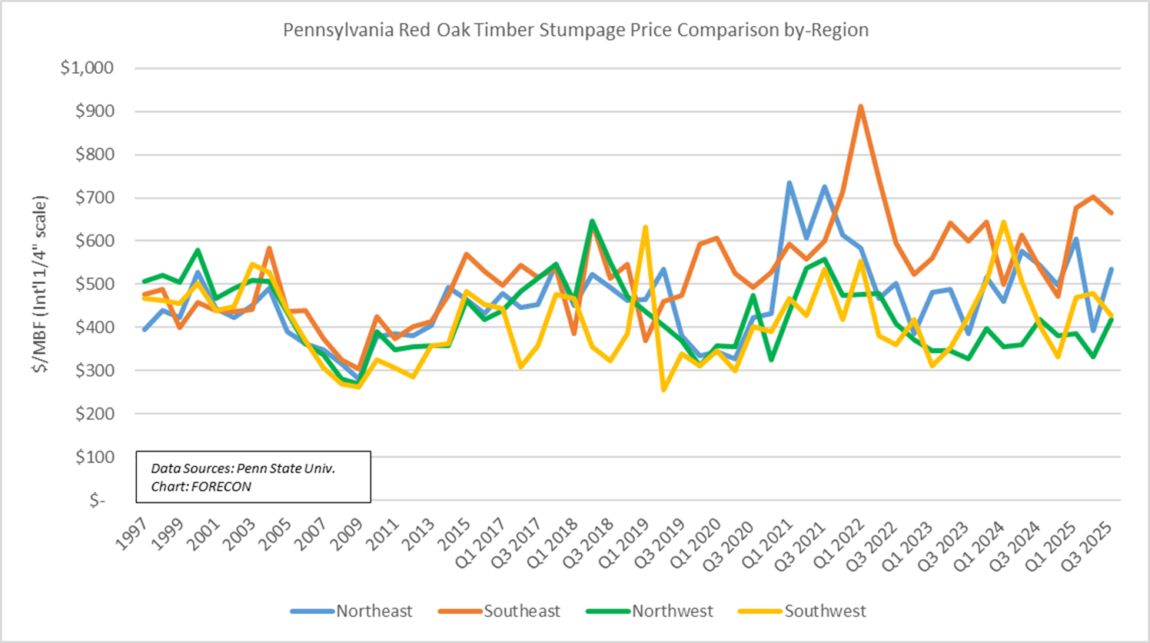
- Red Oak – depending on the quadrant of the Commonwealth, red oak average pricing was generally up compared to last quarter, and fairly flat compared to this time last year, with the exception of a strong annualized price increase in southeastern counties.
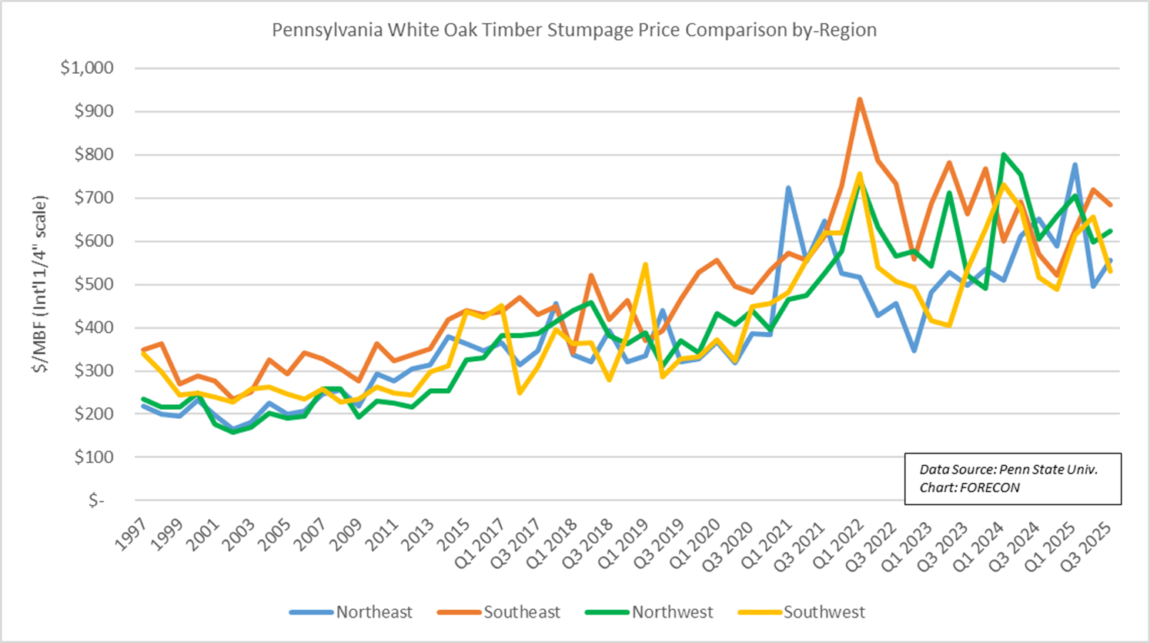
- White Oak – price changes were variable during the past year, depending on the region of Pennsylvania. The statewide 3Q25 average was about $598/MBF (International ¼” scale). Interestingly, one trend we noticed is that sections of the state having a 2Q25 price below $598/MBF tended to see an increase in 3Q25. Meanwhile, sections of the state having a 2Q25 price above $598/MBF tended to see an decrease during 3Q25.
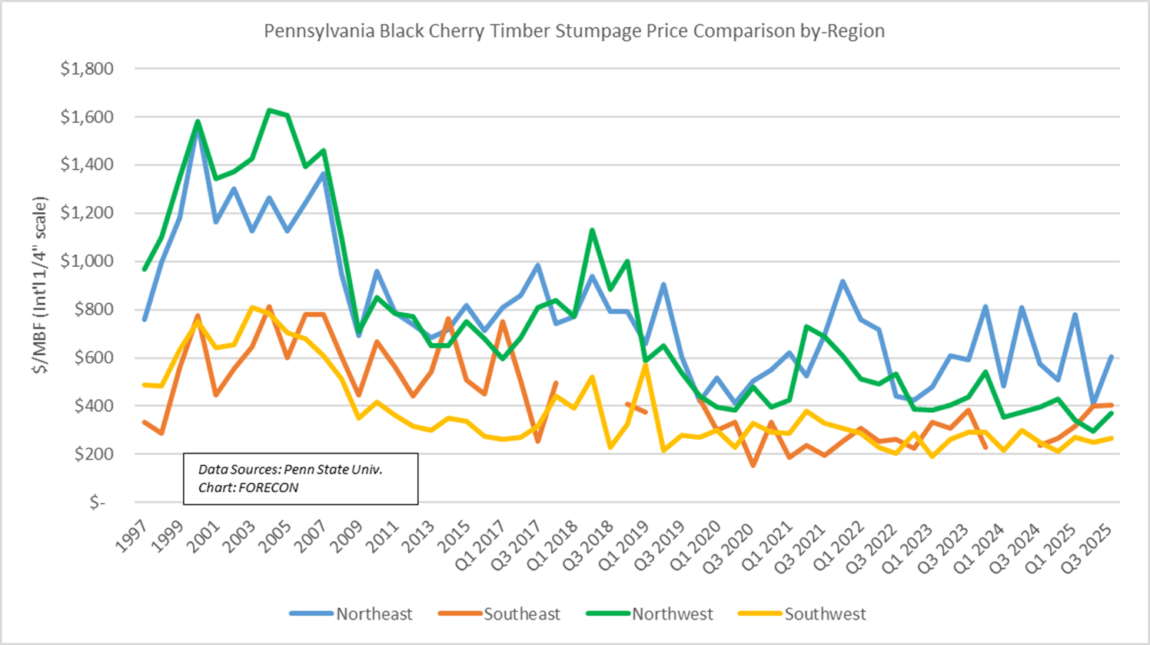
- Black Cherry price movements tended to be upward for the quarter and year over year (YOY), albeit from a fairly low 3Q24 base.
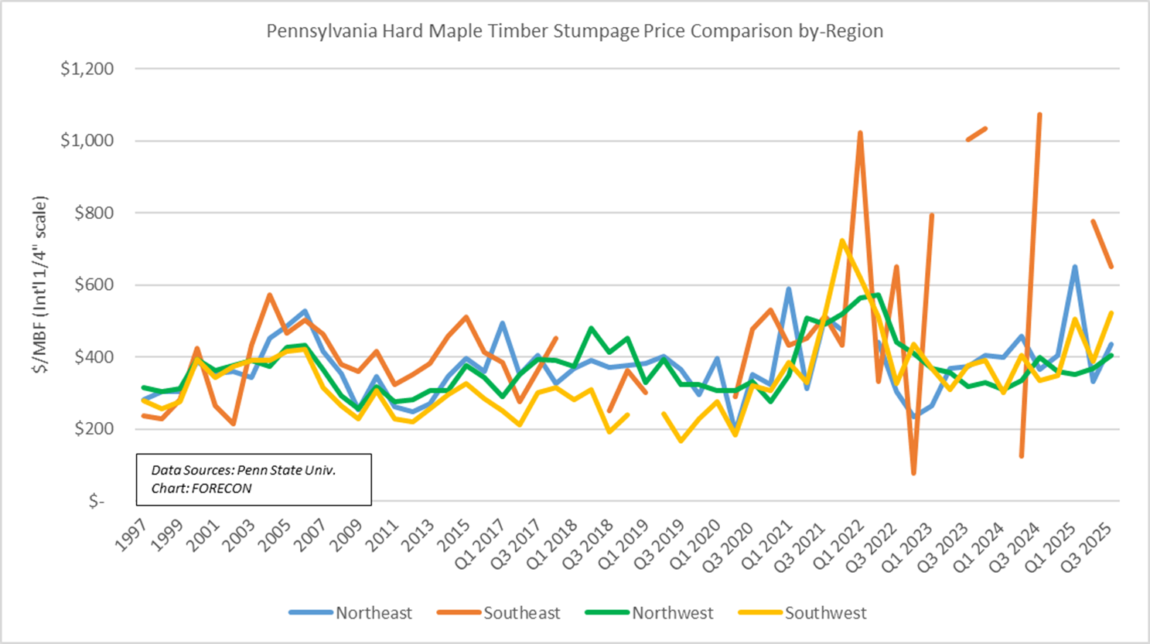
- Hard Maple – except for the southeastern section of the state, hard maple prices tended to increase for the quarter and YOY.
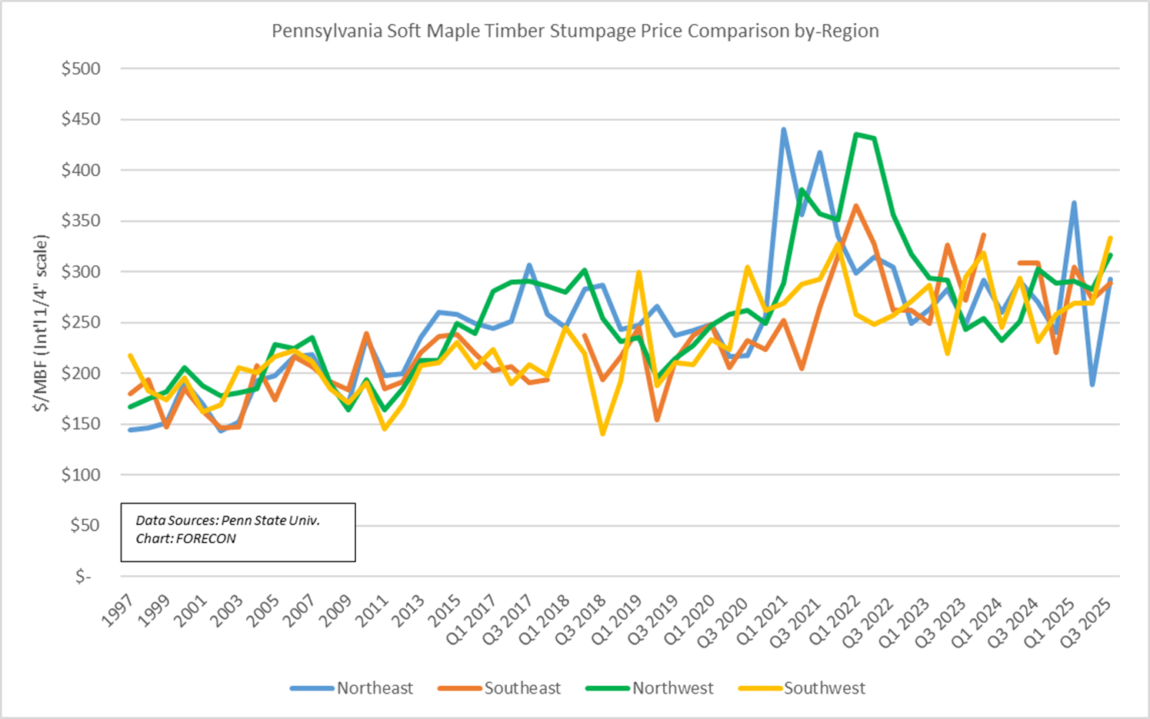
- Soft Maple – prices tended to increase mildly for the quarter and sharply YOY for all sections of Pennsylvania except for the southeastern couties.
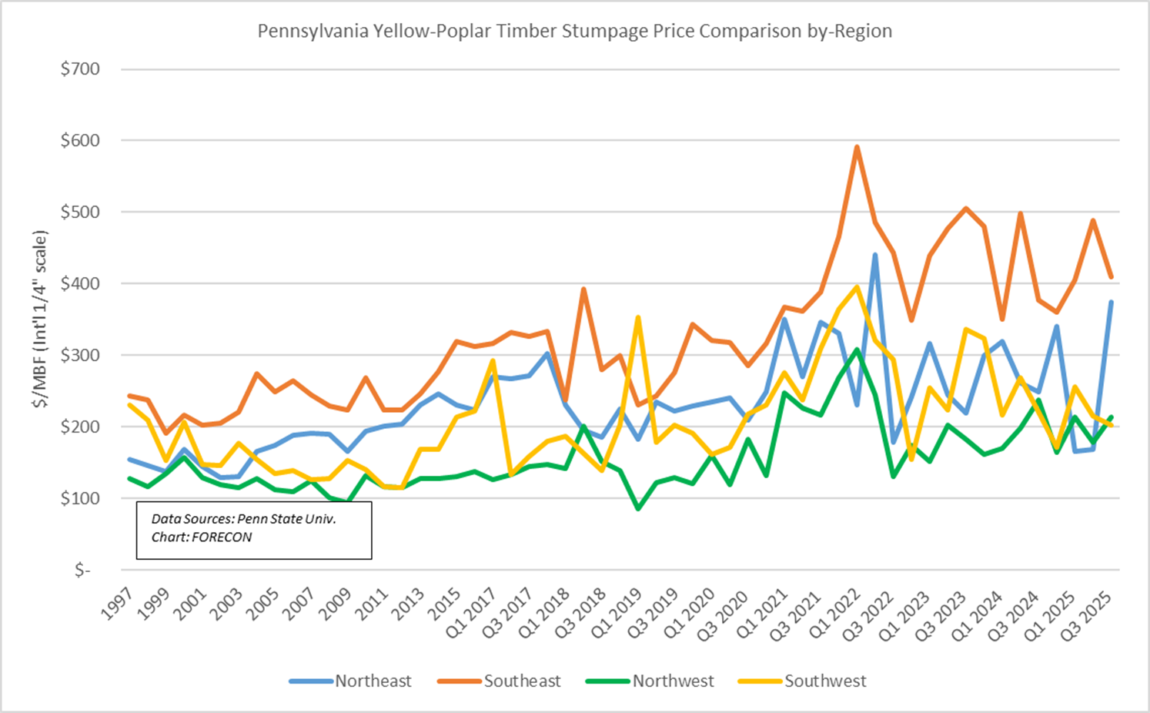
- Yellow Poplar – while this species isn’t heavily represented in all Pennsylvania regions, it’s an important species in some markets, especially in southern counties. The 3Q25 prices tended to increase in eastern counties, and decrease in western counties, compared to last quarter. Looking at the YOY changes, prices tended to increase sharply in northern counties and decrease mildly in southern counties.
For the archive containing the historic Penn State Extension Timber Market Reports, click here.
Please keep in mind, that some quarter’s survey results contain very few responses. When that happens, prices may appear volatile due to the small sample size. Also, despite the various quarterly and annual trends outlined above, high quality timber continues to attract strong interest from bidders throughout the regions we serve. It’s also important to note that the value in your unique woodlot may differ widely from these multi-county averages, discussed further above. Pricing for your specific property’s timber is subject to ever-changing, highly localized markets.
For local, responsive expertise for your unique property, we encourage you to work with one of our seasoned foresters. Reach out to us through our form, below. We’ve been helping landowners like you since 1954!

Penn State Department of Ecosystem Science and Management Recognizes FORECON Inc.
